Introduction
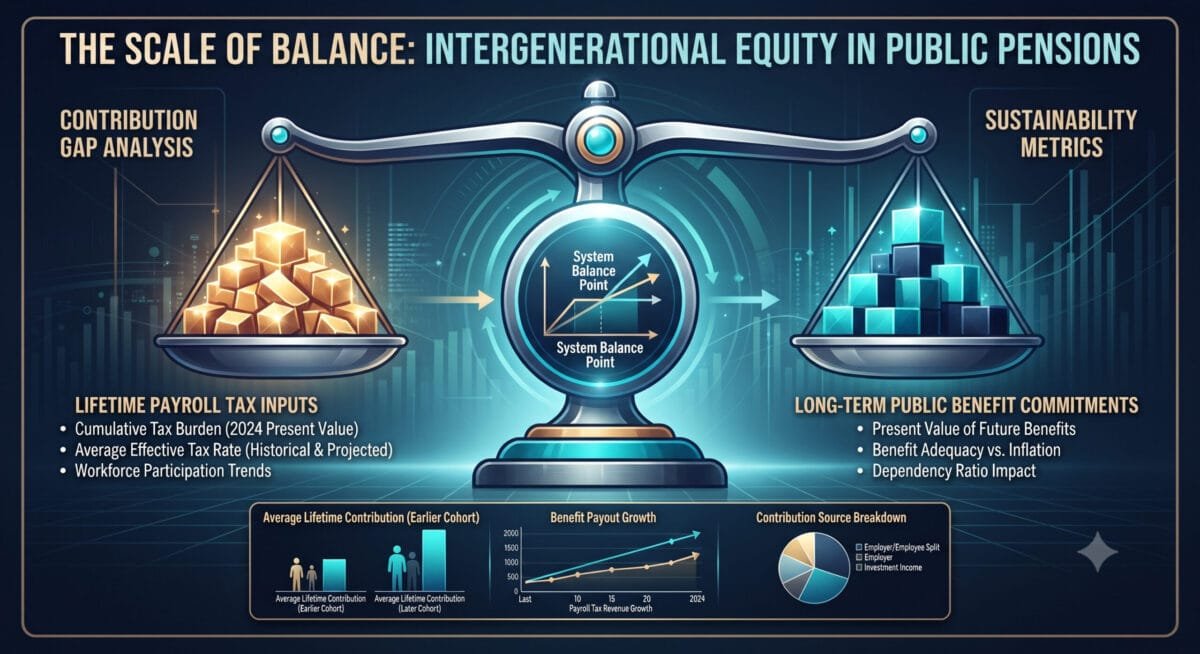
Baby boomer social security returns represent one of the most critical and hotly debated topics in modern personal finance, shaping national economic discussions and individual retirement strategies alike. Recent in-depth analyses from the Committee for a Responsible Federal Budget (CRFB) reveal a startling financial reality: Americans retiring this decade are scheduled to collect roughly 265% of what they personally paid into the federal system in lifetime payroll taxes. While this provides vital financial backing for older adults, it simultaneously places immense structural strain on a pay-as-you-go funding model. Younger generations—particularly millennials entering their peak earning years—are left carrying the heavy fiscal weight of these distributions.
Understanding how these intricate mechanics operate is essential for navigating the evolving landscape of retirement security, anticipating policy shifts, and optimizing your own personal financial roadmap.
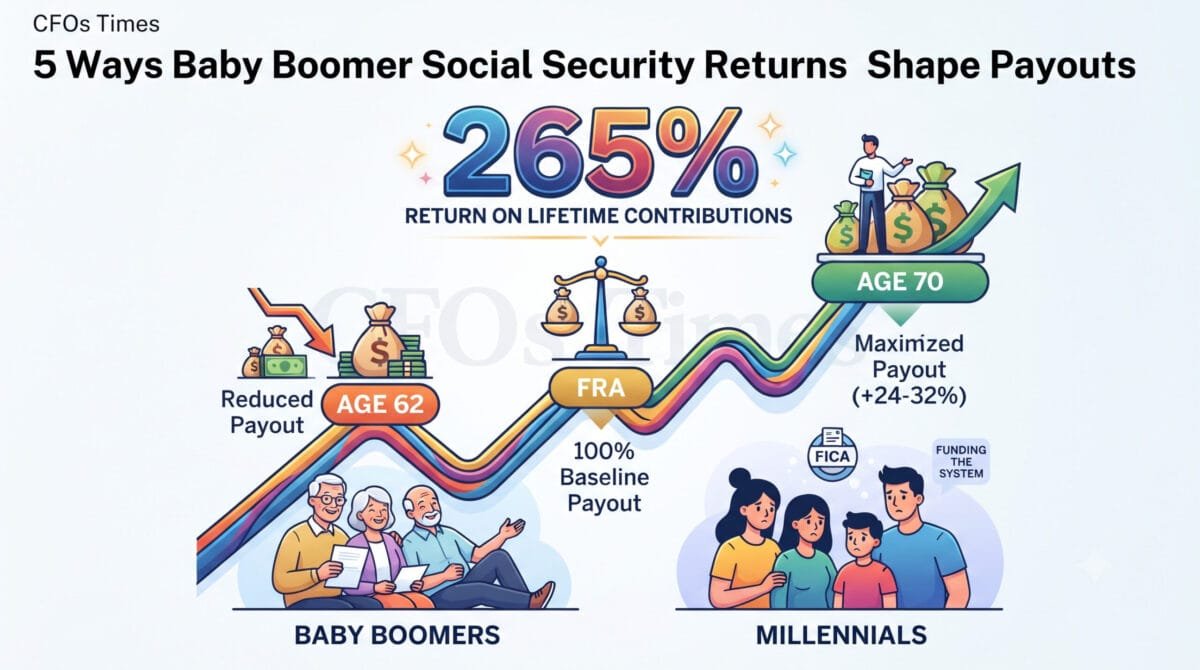
Table of Contents
The Mathematics Behind Baby Boomer Social Security Returns
To fully comprehend why modern retirees receive vastly more benefits than their direct payroll contributions, one must look closely at how the federal entitlement program is structured. Social Security operates fundamentally as a pay-as-you-go (PAYGO) system. This means that the FICA payroll taxes collected from today’s active workforce are not locked away in a private vault or invested for individual compound growth; instead, they immediately fund the monthly benefits of current retirees.
- The Individual Return Disparity: When isolating individual worker contributions, retirees this decade receive about 2.6 times what they directly paid into the system. For median-wage earners, total lifetime benefits can easily cross the seven-figure threshold when combining employer and employee shares.
- The Payback Horizon: For a standard retiree, total lifetime benefits surpass combined payroll tax contributions after roughly six years of collecting, and outpace the worker’s own direct contributions after just three years of drawing benefits.
- Across the Income Spectrum: While lower-income quintiles see even higher relative returns—often collecting over 260% of combined taxes or upwards of 500% of their individual share—even the wealthiest income bracket walks away with roughly double their own direct payments.
Expert Insight: Because the system relies entirely on continuous cash flow from current workers rather than pre-funded capital accumulation, shifting demographic ratios dictate the long-term viability and sustainability of these payout structures. For deeper tracking of system health, you can review the official findings published via the Social Security Administration. Baby Boomer Social Security Returns
The Shrinking Worker-to-Beneficiary Ratio
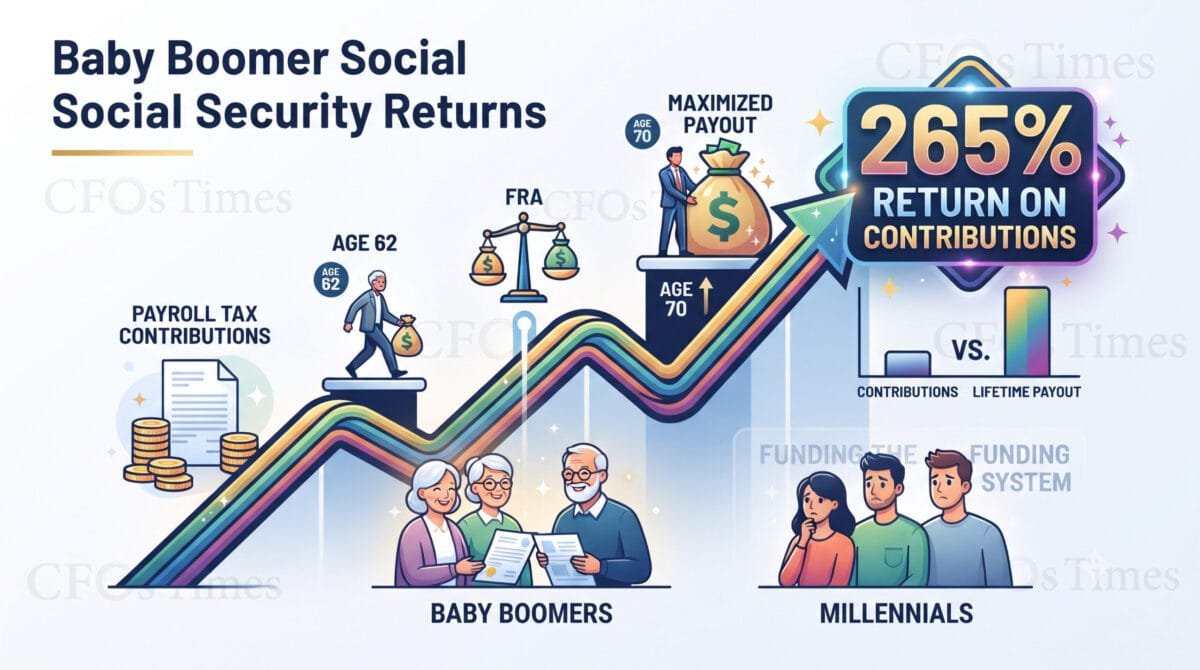
The math behind these high returns relies entirely on historical worker-to-beneficiary ratios that have steadily contracted over the decades due to demographic shifts.
- Historical Context: When the program was originally established and expanded during the mid-20th century, more than 16 active workers supported every single beneficiary, generating massive budgetary surpluses.
- Current Reality: Today, according to updates from the Bipartisan Policy Center, that ratio has plummeted to roughly 2.7 to 2.9 workers per beneficiary, creating a much tighter margin between incoming tax revenues and outgoing monthly benefit checks.
- Future Projections: Driven by an aging baby boom generation and lower fertility rates, the ratio is projected to decline closer to 2 to 1 within the coming decades, intensifying fiscal pressures.
This shrinking base of contributors is precisely why millennials and younger generations face mounting tax burdens, higher payroll tax ceilings, and widespread concerns regarding future program solvency. Baby Boomer Social Security Returns
Comprehensive Comparison of Generational Impact
| Economic Factor | Retiring Baby Boomers | Millennial Workforce |
| Primary Funding Source | Past workforce contributions & expanding labor ratios | High current FICA taxes funding active payouts |
| Average Return Profile | Collects up to 265% of personal input | Faces potential benefit adjustments or higher tax ceilings |
| Systemic Exposure | Benefiting from historical payout formulas | Absorbing trust fund depletion pressures |
| Retirement Horizon | Currently navigating peak distribution phases | Pre-funding future liabilities while building private 401(k) assets |
Strategic Approaches to Maximize Your Returns
Achieving the highest possible return from the federal system requires deliberate coordination between your personal investment portfolios, tax planning, and optimal timing. Whether you are a boomer finalizing your claim or a younger worker planning ahead, several levers dictate your long-term success. Baby Boomer Social Security Returns
1. Timing Your Claiming Decision
Your benefit calculation relies heavily on your highest 35 years of indexed earnings. If you have years with zero or low earnings, working a few extra years can replace those figures and boost your baseline benefit before the primary insurance amount is applied. Furthermore, waiting past your Full Retirement Age up until age 70 accrues delayed retirement credits, increasing your benefit by roughly 8% annually.
2. Managing the Earnings Test
If you claim benefits before reaching your full retirement age while continuing to work, the annual earnings test applies. Income crossing specific statutory thresholds results in temporary benefit withholding, though these amounts are typically recalculated and restored once you hit your FRA.
3. Tax Optimization Strategies
Depending on your combined income—defined as your adjusted gross income plus non-taxable interest plus half of your annual social security benefits—a portion of your returns may be subject to federal income taxes. Utilizing tax-advantaged accounts like Roth IRAs can help manage your taxable bracket strategically. Additional analytical tools and updates are regularly tracked by resources like BigGo Finance. Baby Boomer Social Security Returns
Conclusion-Baby Boomer Social Security Returns
Baby boomer social security returns highlight a profound structural reality within public finance. While retirees are simply collecting the benefits promised by the legal framework they contributed to for decades, the widening gap between contributions and payouts requires urgent policy attention. Bridging the divide between generational expectations and fiscal sustainability remains one of the defining economic challenges of our time. By proactively understanding these dynamics, individuals can better navigate their own financial planning and prepare for an evolving retirement landscape.
Frequently Asked Questions (FAQs)
What do baby boomer social security returns average?
According to recent Committee for a Responsible Federal Budget (CRFB) data, retirees retiring this decade are scheduled to collect roughly 265% of what they personally paid into the system in direct payroll taxes.
Why are younger generations paying more?
Because Social Security is a pay-as-you-go system, current payroll taxes collected from active workers directly fund current retiree benefits. A shrinking worker-to-beneficiary ratio shifts a heavier financial load onto millennials and younger workers.
Is Social Security a personal savings account?
No. Contributions are not locked into individual accounts or invested for private market return; instead, they immediately finance current beneficiaries.
How can I minimize taxes on my retirement distributions?
Strategic asset location—such as balancing distributions across Roth accounts, taxable brokerages, and tax-deferred pensions—can help keep your combined income below federal taxation thresholds.
Disclaimer:
The content of Baby Boomer Social Security Returns published on CFOs Times (including articles, analyses, projections, and commentary regarding Social Security returns, retirement planning, and public finance) is for informational, educational, and journalistic purposes only. It should not be construed as professional financial, legal, or tax advice.
While we strive to source data accurately from reputable institutions—such as the Committee for a Responsible Federal Budget (CRFB) and government publications—economic policies, tax brackets, and federal benefit formulas are subject to change. Readers should evaluate their own unique financial situation, consult with a qualified certified financial planner (CFP) or tax professional, and conduct independent research before making any major retirement or investment decisions. CFOs Times and its authors assume no liability for any financial losses or decisions made based on the information provided on this platform.

Dr. Dinesh Kumar Sharma is a CMA an award-winning Chief Financial Officer and Director of Finance with over 25 years of expertise in strategic planning and digital transformation. Recognized as a five-time CFO of the Year, he specializes in leveraging Generative AI and Microsoft Copilot to optimize financial forecasting and cost management. Dr. Sharma holds a Doctorate in Management (Finance) and has successfully scaled organizations from INR 1 billion to INR 7 billion. He is dedicated to providing transparent, data-driven insights for modern decision-makers at CFOs Times.