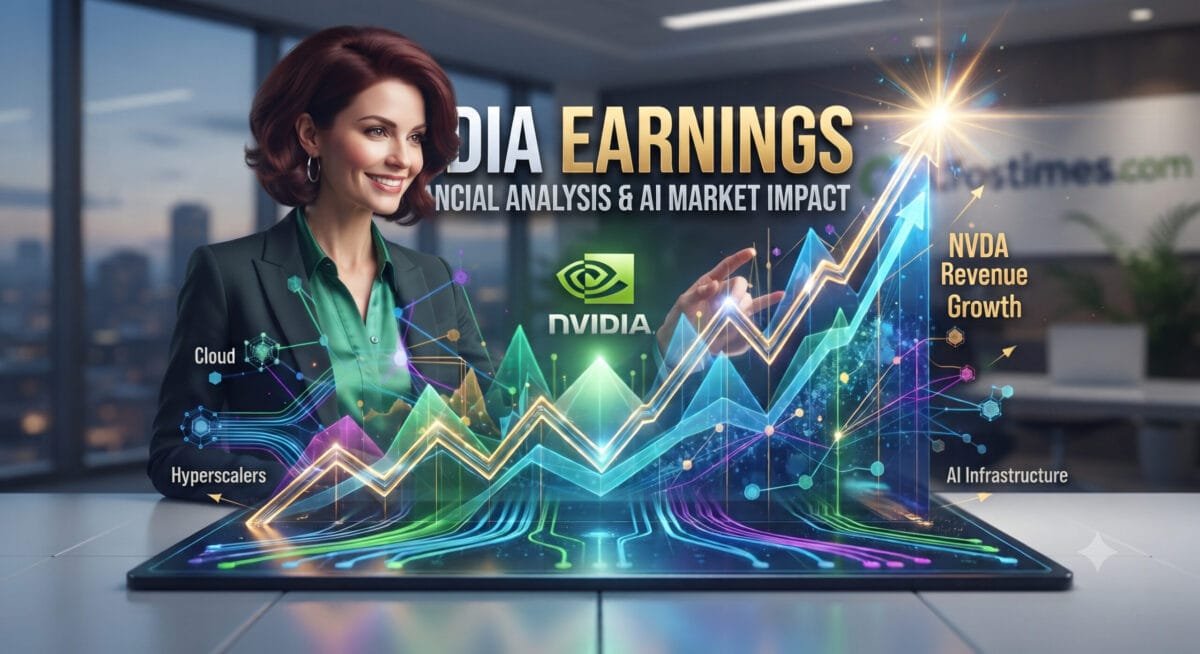
The corporate technology sector revolves around a single definitive financial heartbeat: Nvidia earnings reports. As artificial intelligence transitions from an experimental asset class into foundational corporate infrastructure, Nvidia (NASDAQ: NVDA) remains the primary economic proxy for the entire generative AI revolution. Market participants, institutional investors, and corporate strategists scrutinize every quarterly release not just for headline revenue figures, but as a macroeconomic barometer for global capital expenditure.
Evaluating the latest financial disclosures requires looking beyond the sheer magnitude of the numbers. It demands a rigorous examination of gross margin sustainability, data center concentration risks, hyperscaler commitments, and the shifting dynamics of global supply chains. This comprehensive analysis breaks down what the current earnings cycle reveals about the trajectory of enterprise computing and macroeconomic wealth generation.
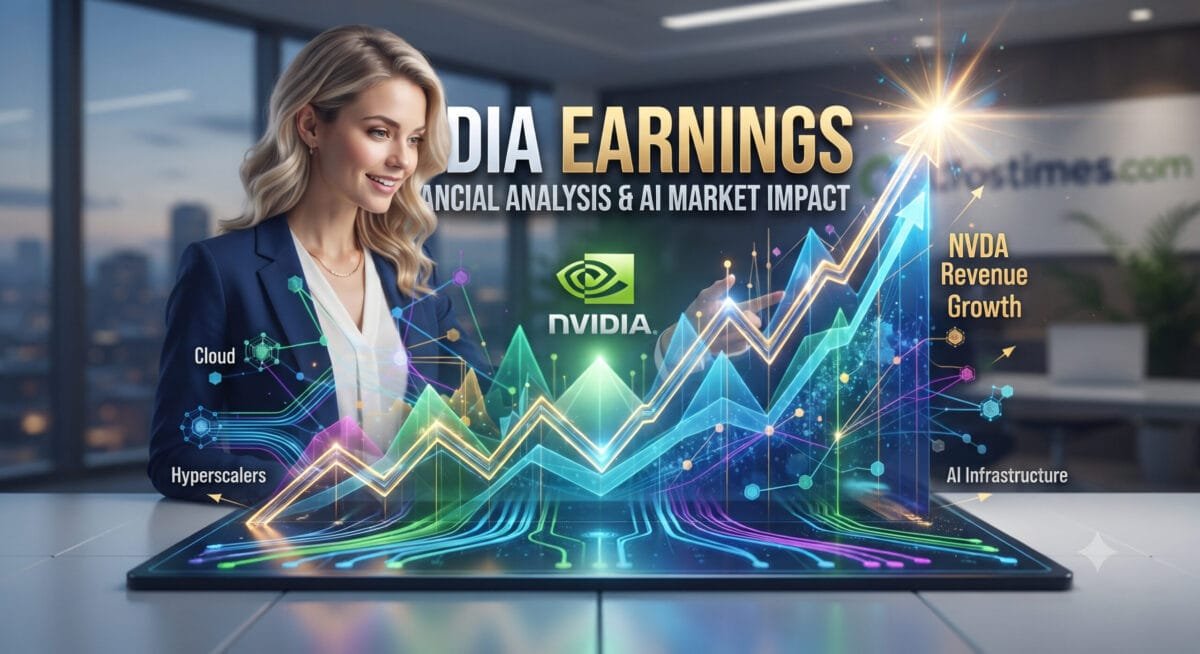
Table of Contents
Macroeconomic Context: The Scale of Modern AI Capital Expenditure
To understand modern Nvidia earnings, one must first analyze the unprecedented capital expenditure (capex) cycle deployed by major cloud hyperscalers—specifically Alphabet, Amazon, Microsoft, and Meta. Collective quarterly capex figures among these major entities have scaled dramatically, crossing historic thresholds to support massive cluster expansions.
- Hyperscaler Expansion: Leading cloud providers continue to scale infrastructure to train next-generation large language models and manage heavy agentic inference workloads.
- The Lead-Time Dynamic: Historical tracking indicates a reliable one-to-two-quarter lag between hyperscaler cash commitments and supplier revenue realization.
- Enterprise Adoption Curves: Beyond consumer tech giants, traditional multinational corporations are integrating proprietary models, locking in long-term demand for high-performance graphics processing units.
This synchronized spending surge has fundamentally altered corporate finance models. CFOs across the technology landscape are prioritizing accelerated computing infrastructure over legacy IT upgrades, establishing a structural shift in how enterprise budgets are allocated globally.
Dissecting the Financial Metrics: Revenue, Margins, and EPS
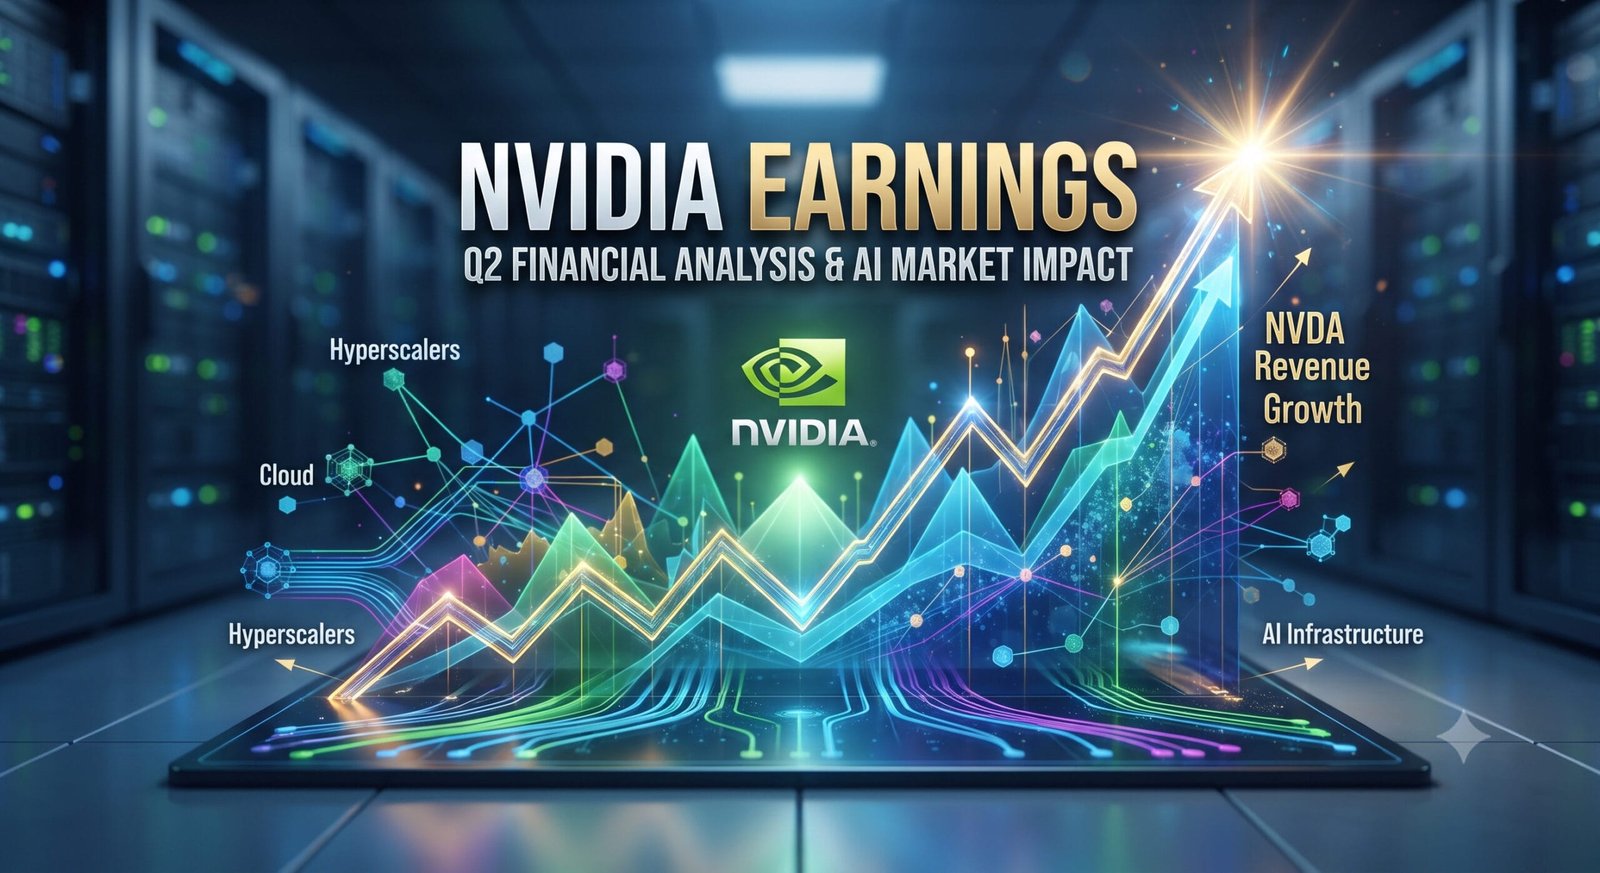
A granular review of recent fiscal reports highlights extraordinary growth vectors alongside subtle normalization trends. While quarter-over-quarter percentage growth rates naturally compress as the baseline expands, absolute dollar additions continue to break records.
Revenue and Segment Performance
The primary driver behind headline beats remains the Data Center segment, which accounts for the vast majority of total corporate revenue. Shipments of advanced architecture systems—ranging from early Blackwell rollouts to high-density rack configurations—continue to command premium pricing.
| Financial Metric | Recent Performance Trajectory | Market Consensus Alignment |
| Total Revenue | Multi-billion dollar sequential increases | Slightly exceeding conservative management guidance |
| Data Center Share | Represents ~98-99% of incremental top-line growth | Dominates portfolio mix over Gaming and Automotive |
| Gross Margins | Sustained around the mid-75% non-GAAP range | Reflects unmatched manufacturing pricing power |
| Diluted EPS | Expanding in tandem with net income leverage | Consistently outperforming Wall Street expectations |
Gross Margin Resilience
A critical focal point for financial analysts is the stability of non-GAAP gross margins. Despite rising manufacturing complexities associated with advanced packaging, wafer allocations, and next-generation memory integration, margins have successfully held their ground near the 75% threshold. This defense of profitability underscores the pricing power afforded by proprietary software ecosystems like CUDA, which create high switching costs for enterprise clients. Nvidia Earnings
Supply Chain Dynamics and Customer Concentration Risks
While top-line growth captures public attention, risk management frameworks require a careful look at operational vulnerabilities. Two structural elements consistently surface in regulatory filings: customer concentration and geopolitical export controls.
- Customer Concentration: A small cohort of major cloud service providers and specialized AI infrastructure startups accounts for a dominant share of accounts receivable. This high dependency means that any strategic capex pause by even one primary buyer could introduce temporary revenue volatility.
- Geopolitical and Export Restrictions: Navigating compliance frameworks regarding advanced semiconductor shipments to restricted regions remains a complex operational challenge. While management continues to adapt by diversifying market strategies and prioritizing unrestricted jurisdictions, regulatory shifts remain an external variable to monitor closely.
For deeper insights into macroeconomic reporting and regulatory frameworks affecting global technology leaders, corporate decision-makers frequently consult financial analyses published by authoritative resources like Bloomberg Technology and the U.S. Securities and Exchange Commission. Nvidia Earnings
The Forward Outlook: Beyond Blackwell to Future Architectures
The market valuation of semiconductor leaders depends less on historical performance and more on forward-looking guidance. As architectures transition from initial deployment phases toward advanced iterations like the Vera Rubin platform, the economic focus shifts toward lowering inference latency and improving energy efficiency per token.
- Inference vs. Training: As foundational models mature, enterprise focus shifts from massive pre-training runs to continuous, real-time agentic inference. This shifts hardware requirements toward memory bandwidth and power efficiency.
- Guidance Precision: Management’s forward guidance continues to set the benchmark for industry health. Consecutive quarters of outperforming conservative estimates highlight a disciplined approach to managing high-visibility demand curves.
For ongoing updates regarding official corporate filings, investors can review primary disclosures directly through the Nvidia Investor Relations Portal. Nvidia Earnings
Frequently Asked Questions-Nvidia Earnings
What drives the massive scale in Nvidia earnings?
The primary driver is unrelenting global demand for accelerated computing infrastructure from cloud hyperscalers and enterprises building out large-scale generative AI systems and agentic workflows.
How do gross margins impact overall financial health?
Maintaining non-GAAP gross margins near 75% ensures that top-line revenue translates directly into massive operating leverage, record net income, and robust free cash flow generation.
Why is the forward outlook more scrutinized than reported numbers?
Because market valuations price in future growth, the quarterly guidance range and management commentary on upcoming architecture cycles provide the clearest signal regarding the sustainability of the AI capital expenditure supercycle. Nvidia Earnings
Conclusion- Nvidia Earnings
The narrative surrounding Nvidia earnings transcends traditional quarterly reporting; it serves as the ultimate litmus test for the digital economy’s capital allocation. By consistently delivering record-breaking revenues, defending elite margin profiles, and staying ahead of technological inflections, the company has anchored the modern corporate finance landscape. While risks involving customer concentration and macroeconomic cyclicality require constant monitoring, the immediate financial reality is clear: the infrastructure buildout powering the intelligence era is operating at full throttle.
Financial Disclaimer
Disclaimer: The content published on CFOs Times (cfostimes.com) is for informational, educational, and analytical purposes only and should not be construed as professional financial, investment, or legal advice. The analysis of Nvidia earnings (NASDAQ: NVDA) and related corporate metrics is based on publicly available filings, market reports, and management disclosures believed to be reliable as of the publication date.
Executive decisions, market conditions, and regulatory environments change rapidly. Readers, corporate strategists, and investors should conduct their own independent due diligence, review official SEC filings, and consult with a licensed financial advisor or certified professional before making any investment or capital allocation decisions. CFOs Times, its editors, and its contributors assume no liability for any financial losses or direct/indirect damages resulting from the use of or reliance on the information provided in this article.

Dr. Dinesh Kumar Sharma is a CMA an award-winning Chief Financial Officer and Director of Finance with over 25 years of expertise in strategic planning and digital transformation. Recognized as a five-time CFO of the Year, he specializes in leveraging Generative AI and Microsoft Copilot to optimize financial forecasting and cost management. Dr. Sharma holds a Doctorate in Management (Finance) and has successfully scaled organizations from INR 1 billion to INR 7 billion. He is dedicated to providing transparent, data-driven insights for modern decision-makers at CFOs Times.









3 thoughts on “Nvidia Earnings Surge: Phenomenal Q2 Financial Analysis & AI Impact”