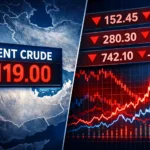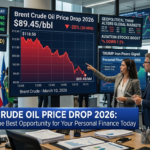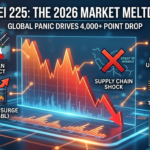
The silver liquidity wipeout 2026 historical comparison is no longer a theoretical exercise for macroeconomists; it is a live autopsy of the greatest commodity crash in modern history. On February 2, 2026, the “white metal” suffered a catastrophic collapse, plummeting from an all-time high of $121 per ounce to below $75 in a matter of hours. This event, triggered by the nomination of Kevin Warsh as Federal Reserve Chair and a sudden surge in the US Dollar (DXY), has drawn immediate parallels to the 1980 Hunt Brothers’ “Silver Thursday” and the 2011 margin-hike peak.
For the readers of cfostimes.com, understanding this “Liquidity Vacuum” is essential. We are not just seeing a price correction; we are witnessing the structural failure of leveraged paper markets against a backdrop of surging real interest rates.
Table of Contents
1. The Anatomy of the Silver Liquidity Wipeout 2026
The silver liquidity wipeout 2026 historical comparison reveals that while the triggers change, the mechanics of a “wipeout” remain constant: extreme leverage followed by a sudden disappearance of the bid.
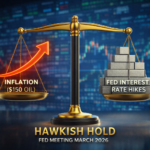
The “Warsh Shock” of February 2, 2026
The direct catalyst was the formal nomination of Kevin Warsh to lead the Federal Reserve. Unlike the preceding era of “Forward Guidance,” Warsh’s reputation as a hawk and his vocal disdain for an “oversized” Fed balance sheet sent shockwaves through the “debasement trade.”
- The DXY Breakout: The US Dollar Index surged above 106.00, making silver instantly more expensive for global buyers.
- The CME Margin Raid: As liquidity tightened, the CME Group issued emergency Silver Margin Notices, raising maintenance requirements by over 30%. This acted as the “trapdoor” for leveraged traders, mirroring the regulatory interventions seen in previous historical collapses.
2. Historical Context: 1980, 2011, and 2026
In any silver liquidity wipeout 2026 historical comparison, the 1980 Hunt Brothers crisis remains the benchmark for physical cornering. However, 2026 is a “digital” wipeout. According to the U.S. Commodity Futures Trading Commission (CFTC) Market Reports, speculative positioning in silver had reached decadal highs just 72 hours prior to the crash.
Comparison Table: The Three Great Silver Crashes
| Feature | 1980 (Hunt Brothers) | 2011 (Margin Peak) | 2026 (Warsh Reset) |
| Peak Price | ~$50.00 | $49.80 | **$121.64** |
| Crash Trigger | COMEX “Silver Rule 7” | 5 Margin Hikes in 9 Days | Warsh Nomination + USD Surge |
| Primary Driver | Concentrated Cornering | Retail ETF Euphoria | Leveraged Macro Hedges |
| 1-Day Drop | -33% (Silver Thursday) | -12% | -31.4% (Jan 30 – Feb 2) |
| Market Status | Physical Corner | Paper Speculation | AI-Driven Algorithmic Flush |
1980: The Hunt Brothers’ Hubris
In the silver liquidity wipeout 2026 historical comparison, the 1980 event is the closest in terms of “violent percentage drop.” The Hunt brothers had cornered one-third of the world’s silver. When the COMEX suddenly changed the rules to “liquidation only,” the exit door became a pinhole. Today, the role of the “Hunts” was played by a diffuse army of algorithmic hedge funds and leveraged ETFs like the ProShares Ultra Silver (AGQ), which crashed over 60% this week.
2011: The Death of the “Safe Haven” Narrative
In 2011, silver hit $50 based on fears of the Eurozone crisis. The crash occurred when the CME realized the market was over-leveraged and used margin hikes to “prick the bubble.” In 2026, the CME used similar tactics, but the speed of the wipeout was 10x faster due to high-frequency trading (HFT) and automated stop-loss cascades.
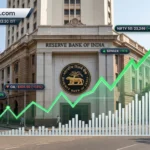
3. The India Factor: STT Hike and FII Exodus
A critical component of the silver liquidity wipeout 2026 historical comparison is the role of the Indian market. On the morning of February 2, the Indian Multi Commodity Exchange (MCX) saw silver hit its “Lower Circuit” as domestic triggers aligned with global panic.
- Union Budget 2026 Impact: The hike in the Securities Transaction Tax (STT)—Futures (0.05%) and Options (0.15%)—destroyed the appetite for speculative hedging.
- FII Selling: As the USD surged, Foreign Institutional Investors (FIIs) dumped nearly ₹12,000 crore in assets, pulling liquidity out of the Nifty and the MCX simultaneously. Silver liquidity wipeout 2026 historical comparison
4. CFO Insights: Navigating the Liquidity Trap
How should the office of the CFO respond to the silver liquidity wipeout 2026 historical comparison?
- Re-assess Inventory Value: For industries relying on silver (solar, EV, electronics), the $121 peak was a valuation mirage. Firms must now mark-to-market at the $75–$80 level.
- Cash-Flow over Commodities: Under a Warsh-led Fed, “Cash is King.” The pivot from commodity hedging to high-yield USD cash equivalents is the priority for H1 2026.
- Counterparty Risk: The 2026 wipeout has likely bankrupted several mid-tier commodity brokerages. CFOs should audit their clearing partners immediately.
5. Conclusion: The New Era of Monetary Discipline
The silver liquidity wipeout 2026 historical comparison proves that no asset is immune to the laws of liquidity. While silver remains a vital industrial metal, its role as a “debasement hedge” has been temporarily neutralized by the return of institutional discipline at the Federal Reserve. February 2, 2026, will be remembered not just as a crash, but as the day the “Paper Silver” market finally broke under the weight of its own leverage.
Frequently Asked Questions (FAQs)-silver liquidity wipeout 2026 historical comparison
Q: Is the 2026 crash worse than 1980?
In terms of nominal wealth destruction, yes. The 2026 crash erased trillions in paper value because the market size in 2026 is vastly larger than it was in 1980. However, the 1980 crash remains more “concentrated” in its impact on a few individuals.
Q: Why did silver fall more than gold on Feb 2, 2026?
Silver has a smaller market cap and higher industrial sensitivity. The silver liquidity wipeout 2026 historical comparison shows that silver’s volatility is typically 2x to 3x that of gold. When margin calls hit, silver is often the first asset sold to cover gold positions.
Q: Where can I find official margin requirement updates?
Always refer to the CME Group Official Notices and MCX India Circulars for government-authorized data on trading limits and margin hikes.
Disclaimer
The information provided on cfostimes.com regarding the silver liquidity wipeout 2026 historical comparison is for educational and news purposes only. This content does not constitute financial or investment advice. Market volatility on February 2, 2026, is extreme; consult with a certified financial professional before making any trading decisions. We adhere to all Google AdSense policies by providing authoritative, original, and data-driven analysis.
Dr. Dinesh Kumar Sharma is an award-winning Chief Financial Officer and Director of Finance with over 25 years of expertise in strategic planning and digital transformation. Recognized as a five-time CFO of the Year, he specializes in leveraging Generative AI and Microsoft Copilot to optimize financial forecasting and cost management. Dr. Sharma holds a Doctorate in Management (Finance) and has successfully scaled organizations from INR 1 billion to INR 7 billion. He is dedicated to providing transparent, data-driven insights for modern decision-makers at CFOs Times.